
This is the second of a series of posts looking the StorPool software-defined storage platform. In this post we look at performance, quality of service (QoS) and monitoring.
The StorPool platform can be deployed in a dedicated storage configuration, or in a hyper-converged model that implements storage services and applications on the same infrastructure. To guarantee that storage performance can be delivered effectively, StorPool implements Linux control groups (cgroups) to ensure CPU and memory resources are ring-fenced for the StorPool processes. The main services started on a StorPool deployment include:

- beacon – this service advertises the availability of the node on which the service runs, while validating the availability of other visible nodes in a cluster.
- block – provides block initiator services to the local host.
- bridge – this service co-ordinate snapshots between multiple clusters.
- controller – provides statistics collection for the API.
- Iscsi – manages devices exported to clients as iSCSI volumes.
- mgmt – this service manages requests from the CLI and API.
- nvmed – runs on all nodes with NVMe devices to co-ordinate device management.
- server – this service runs on all nodes that provide storage into a cluster. On nodes with multiple disk devices, up to four server instances can be running.
- stat – this service collects metrics on running systems, including CPU utilisation, memory utilisation, network and I/O statistics.
The screenshot in figure 1 shows the output for services running on one cluster node (in this case, PS09). In this instance only one service is not running (reaffirm), which is deprecated in the version of StorPool being tested.

StorPool helpfully provides a tool to display the cgroup configuration that applies to the StorPool services. On this machine, the two sockets (CPUs) have eight cores and 16 threads, with services assigned to specific processors and memory assigned to the StorPool common services and alloc services (mgmt, iscsi and bridge).
We can display the cgroup assignments for the StorPool services without having to look at the control group configuration. The output of the storpool_cg command is shown in figure 2. It’s important to remember that these assignments don’t dedicate resources to these services, but ensure they receive a guaranteed slice of processor and memory to deliver storage services. This is important in hyper-converged environments that don’t run as dedicated storage nodes or for systems that are client-only, with no storage resources and only running the StorPool device endpoint.
Performance Validation
To prove out the performance of the StorPool platform, we ran a series of tests against our test StorPool environment, with a configuration as follows:
- 3x Dell PowerEdge R640 servers (PS09, PS10, PS11), configured with:
- Dual Intel Xeon Silver 4108 CPUs, 1.8GHz
- 64GB system memory
- 4x Western Digital Gold NVMe SSD (960GB each)
- 4x 2TB Seagate 7.2K RPM HDD
- 1x Dell PowerEdge R610 server (PS01), configured with:
- Dual Intel Xeon X5570 CPUs, 2.94GHz
- 96GB system memory
- Local drives and StorPool mapped devices
The tests validate the performance of three logical StorPool volume types:
- nvme – a 300GB block device based only on NVMe disks
- hybrid – a 300GB block device based on NVMe and HDD disks
- hdd – a 300GB block device based only on HDD disks
The hybrid device uses an NVMe device as the final mirror as described in the first post in this series. All three logical volumes have three replicas (mirrors).

The first data from the test results shows latency in microseconds (usec or µs). The graph shown in figure 3 quite spectacularly demonstrates the difference between SSDs and HDDs. For 100% random HDD reads, caching and prefetching have no effect, so the latency shown is that of the native drive. In this instance, for PS09 with local disks, we see a value of 7.1 milliseconds (ms), made up of approximately 4.16ms of rotational latency and the rest (2.95ms) of seek time, which is expected for this class of drive. The values for PS01 are slightly higher at 8.46ms, some of which we can attribute to the additional network hop from the client-only server.
More interesting, perhaps are the other data points. Random reads and writes for NVMe SSDs on PS09 and PS01 are around 130-150µs, which is only marginally different on the client-only PS01. However, for hybrid volumes where two mirrors are on HDD and the third on SSD, we see the benefits of favouring reads from SSD and of write caching. Hybrid devices, from a latency perspective, perform at least as well as all-NVMe or even slightly better on read I/O.

In Figure 4 we show random IOPS performance in the three categories across both PS09 and PS01. The figures for PS09 – NVMe set the benchmark at around 100,000 IOPS. The hybrid volume matches read I/O performance, but delivers fewer write IOPS (around half) as the data is written to 2 HDD mirrors out of three and I/O must complete synchronously. The HDD option naturally performs the worst, but still has good performance from software and HDD controller caching.
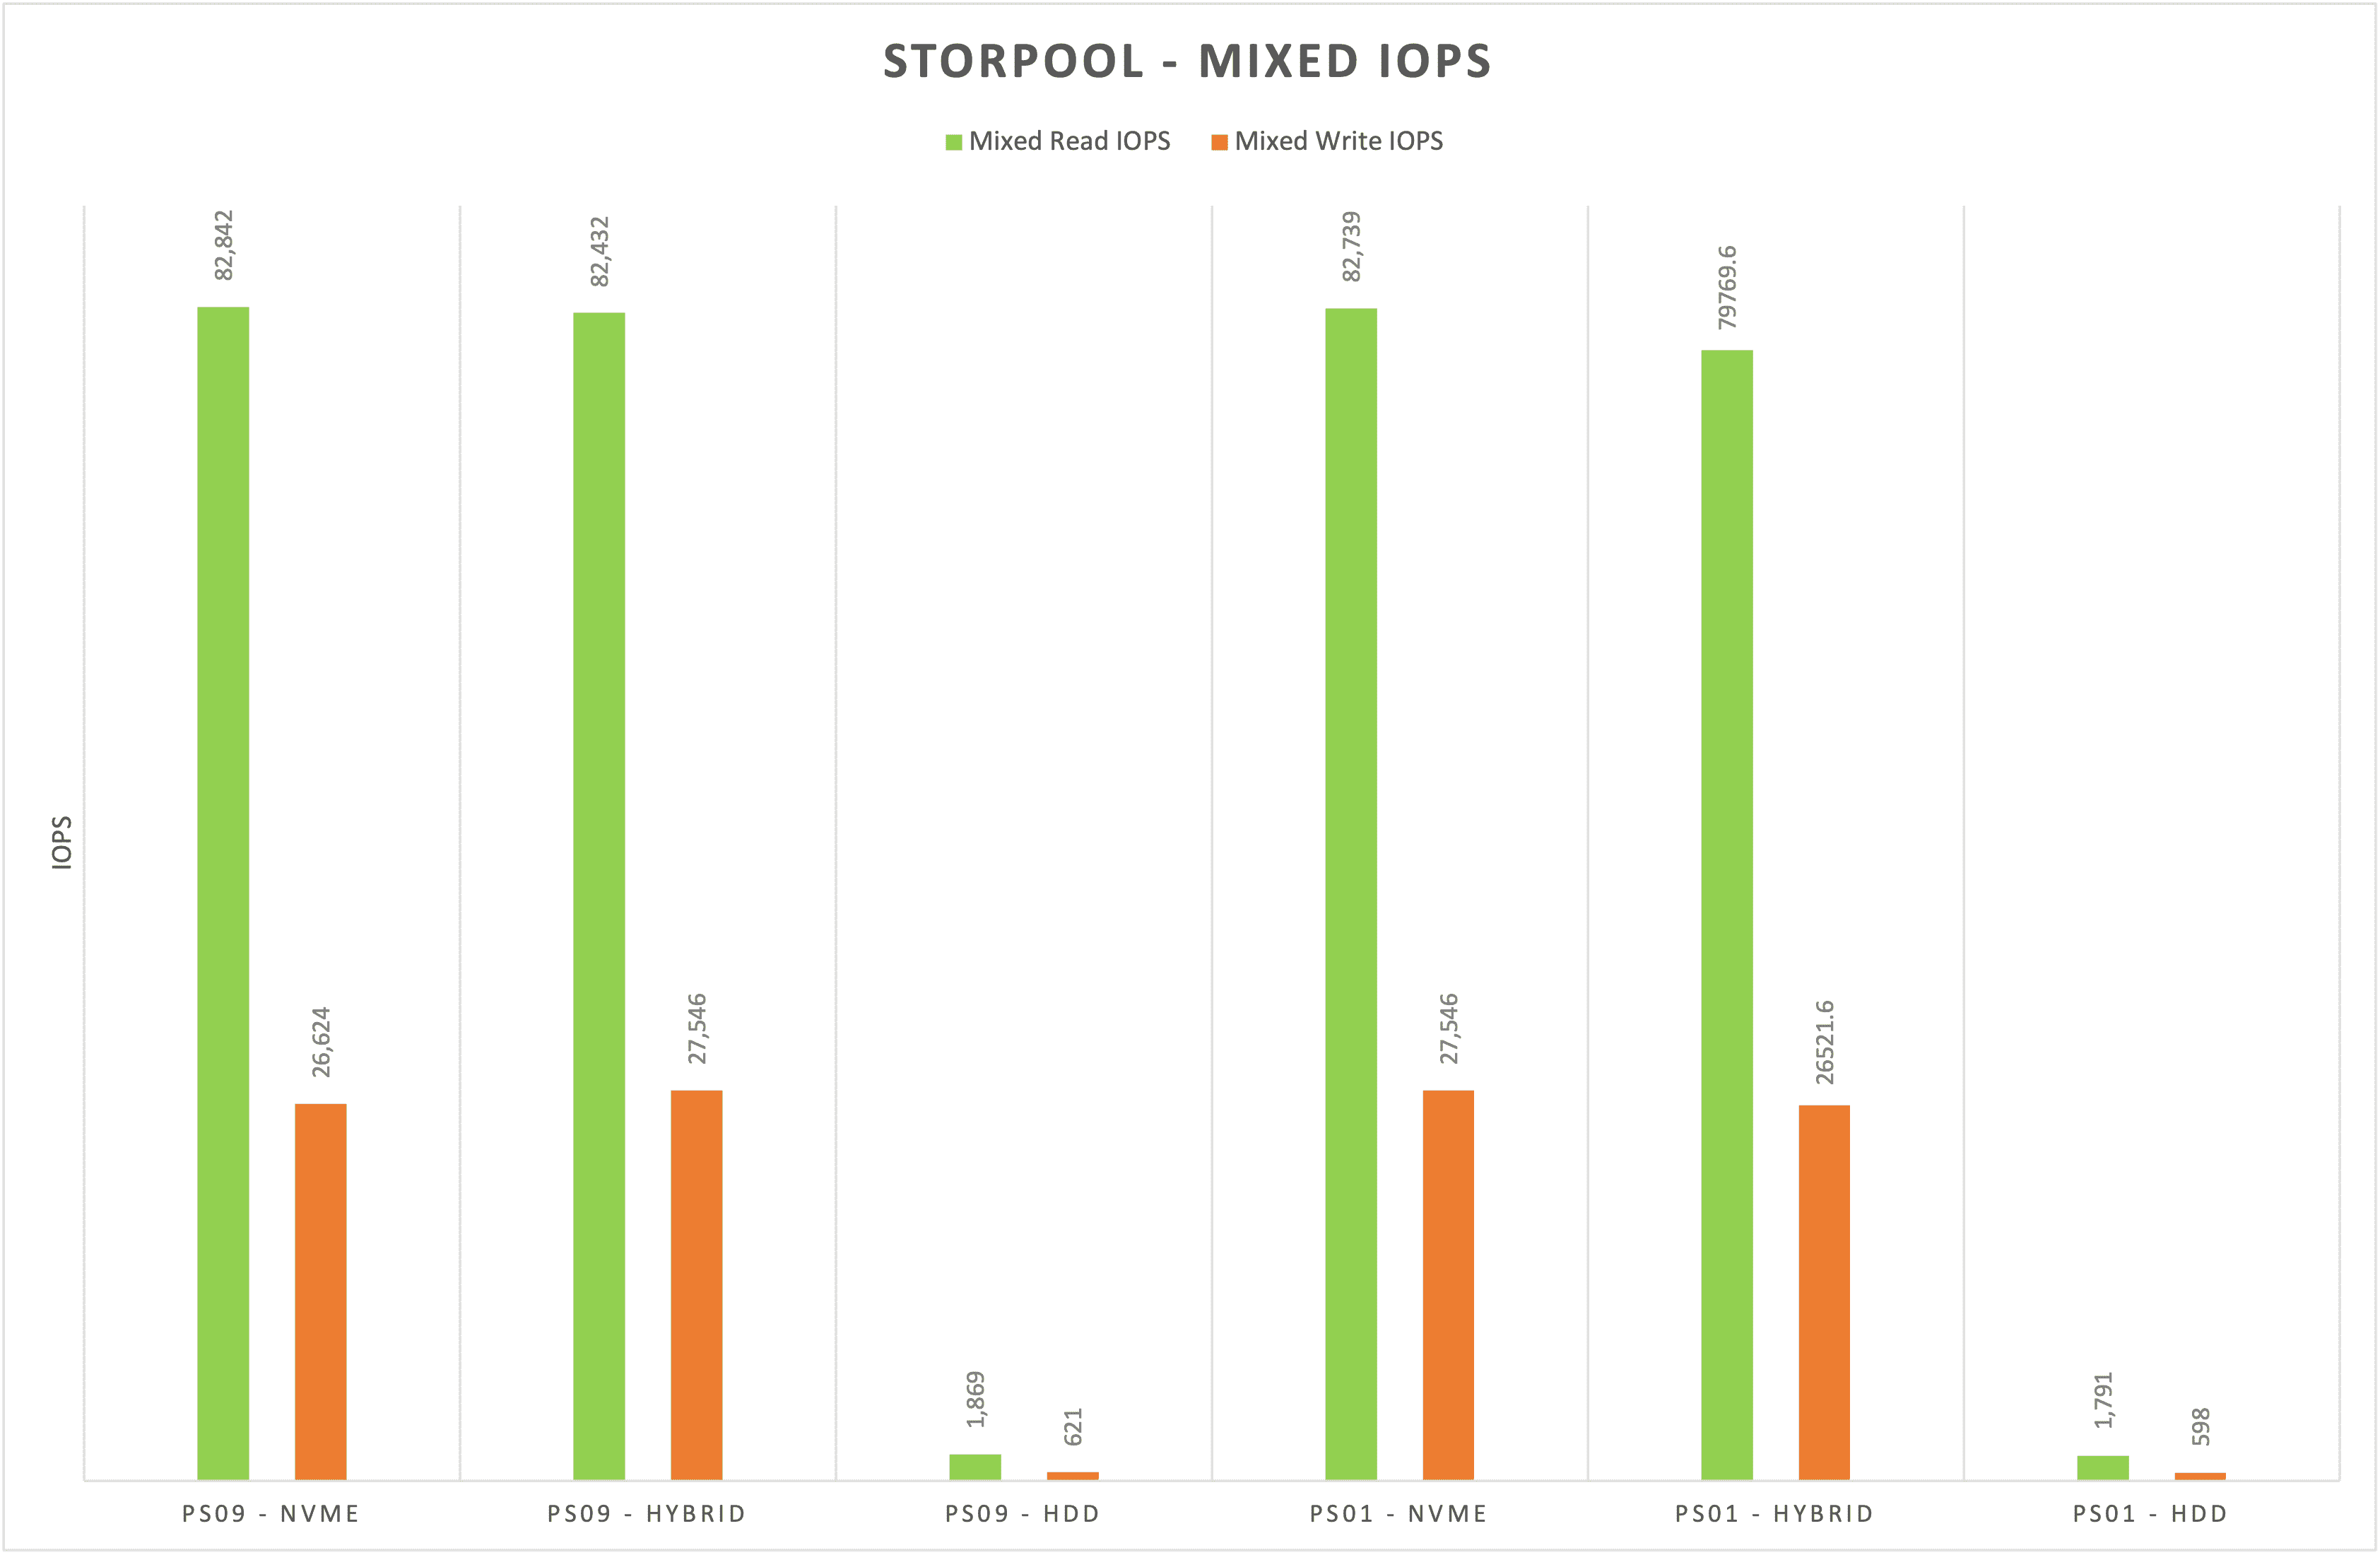
Figure 5 shows mixed IOPS workloads. Here the difference between all-NVMe and hybrid is negligible, although HDDs don’t perform as well as the other two volumes.

Figures 6 and 7 show bandwidth data, with the hybrid volume performing well and offering almost identical performance in sequential throughput.

NVMe, Hybrid or HDD?
When we discussed the placement group options in the first post of this series, the benefits of the choice of mixed mirrors may not have been that obvious. Now that we’ve run performance numbers, we can see that hybrid volumes perform as well as all-NVMe volumes in every case except totally random I/O. Even in this scenario, read I/O is prioritised from the NVMe mirror, so meets or exceeds the all-NVMe numbers.
Customers can be cost-conscious with storage, choosing to use hybrid rather than all-NVMe volumes, with, in most cases, marginal effect on performance. As the template for volumes can be changed dynamically with no impact, volumes may be upgraded or downgraded in performance without refactoring or migrating data. For example, a volume that starts out as all-NVMe may be downgraded to hybrid at any time. This is a significant benefit in multi-tenant environments like those operated by MSPs, where performance can be charged at a premium.
Quality of Service
Another useful performance feature for multi-tenancy is quality of service or QoS. Quality of service metrics can be applied to all StorPool volumes, with limits on either IOPS, bandwidth or both. These specify the maximum throughput permissable, per volume. QoS is useful for several reasons:
- It helps overcome the “noisy neighbour” issue where one application dominates I/O traffic.
- It separates hardware characteristics from the logical requirements of the application, so underlying changes in hardware don’t result in better or worse performance than the application expects.
- It optimises resources, providing more control over volume density.
- It offers a chance for MSPs and internal IT departments to offer “value add” to their customers, charging more for short or long-term increases in bandwidth.
To demonstrate the QoS features of StorPool, we’ve created a short video, which shows the dynamic way in which performance can be modified through the command line.
Dashboards
Finally in this post, I want to discuss dashboard monitoring and some of the data that can be extracted from the StorPool platform. All StorPool systems have monitoring in place that reports platform statistics back to a centralised SaaS tool which shows data through a Grafana portal. The type of data available is vast, with metrics covering every aspect of server and storage. Figure 8 shows the dashboard homepage. Each bar represents a service metric, either server, client or storage-based. Figures 9 & 10 show data for an individual disk and the volume used for the QoS tests.

We’ll cover the dashboard in more detail in a future post, however we highlight it here to show that any aspect of performance can be mapped and visualised.


The Architect’s View™
Storage performance is incredibly important in modern data centres. This is even more the case with multi-tenant environments, whether within a single enterprise or operated by MSPs. In this post we’ve highlighted the granular capabilities of the StorPool platform and shown how these features are dynamically configurable. Our next posts will cover:
- Post 3 – Support for Virtual Environments – VMware, KVM and cloud solutions
- Post 4 – Kubernetes and CSI support
- Post 5 – Failure modes, managing device failures and integrity checking
This work has been made possible through sponsorship from StorPool.
Copyright (c) 2007-2021 – Post #3062 – Brookend Ltd, first published on https://www.architecting.it/blog, do not reproduce without permission.