
We’re probably all familiar with the concept of the HDD or SSD reliability bathtub curve (figure 1). This shows how over the lifetime of a drive, failures typically follow a pattern where failure rate increases over time to a steady state, then increases again as the device wears out. But have you considered the idea of a storage performance bathtub curve?

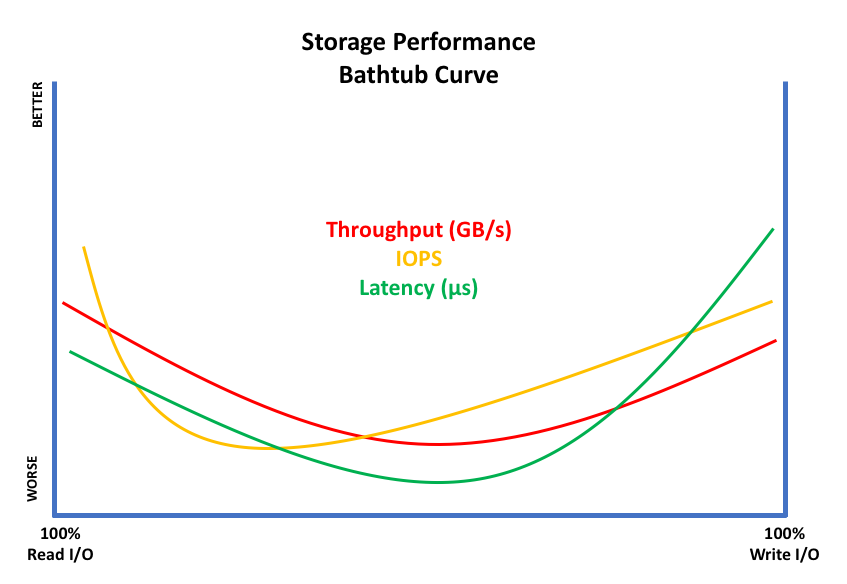
Imagine drawing a graph (figure 2) with 100% read I/O to the left axis and 100% write I/O to the right. At either of these extremes, performance is good. However, in the middle where mixed workloads operate, performance drops, forming a classic “bathtub curve”.
- Storage Performance Benchmarks in Light of Spectre/Meltdown
- Performance Analysis of SAS/SATA and NVMe SSDs
- Storage Performance: Why I/O Profiling Matters
The extent of the curve depth is obviously determined by the effectiveness of the storage array. As shown, for each of the standard metrics (IOPS, throughput, latency) then the lowest point of the curve could be anywhere on the spectrum from 100%R to 100%W.
The question is – do you know how far your curve dips, and how does that compare to what the vendor promised you?
Hero Numbers
Vendor websites advertise what can only be described as storage performance hero numbers. Typically, IOPS are quoted using as small a block size as possible, as that generates a higher number of individual I/O operations – usually at high queue depths. The reverse is true for throughput, where bigger block sizes result in better throughput numbers. Check out your favourite drive manufacturer and you will see this is true. Naturally, the vendor wants to quote their product performance in the best light and that means adjusting the measurements accordingly.
What about latency? Look carefully and especially with storage arrays, you’ll see words like “typical”, “average”, “best”, which don’t really give a fair indication of what’s going on.
Why does Performance Vary?
So, what’s responsible for the performance issues? Let’s concentrate on flash for a moment and think how traditional media works. With SAS/SATA protocols, there is a single queue processing I/O. With all-read requests, the process is quite simple; the controller can process them sequentially and may be able to gain some improvement in reordering if the same part of the flash is being accessed. There are also multiple back-end channels against which the I/O is distributed so some benefits are gained there too.
For 100% write traffic, the process is more complex. Each write will at a minimum mean updating a flash page. At some point, an entire flash block (multiple pages) has to be erased and that means moving around and consolidating pages in free blocks. There are also other factors like wear levelling to consider, so 100% write performance will typically be lower than 100% read, although both benefit from onboard DRAM to cache data (some drives may show higher write performance with single queue depth because of this).
Mixed I/O
When we start to get to mixed I/O (and 70R/30W is a commonly quoted figure) then we start to see numbers that are lower than either read or write. At this point, the architecture of the media gets in the way. As we’ve said, flash is written in blocks and pages, so it’s possible for a write operation to delay (or block) reads of the same block/page until that write has completed. Remember for SAS/SATA this is all taking place with a front-end connection that still only processes a single queue.
Mitigation
Media and array vendors have obviously implemented solutions to overcome these limitations. At the media level, this might mean greater over-provisioning. Custom storage designs as seen in the 2.0 stage of the all-flash revolution brought us products that attempt to overcome the problem of variable flash performance to deliver a more consistent host I/O experience. This is one of the inherent benefits of buying an all-flash system compared to building out a software-defined or HCI type solution. I/O performance is much more deterministic with the better the array vendor understands how the flash works. Incidentally, that brings us back, yet again, to the idea of whether array vendors should build or buy their flash modules/drives and perhaps a good opportunity to update that post.
NVMe
As we move to NVMe-based arrays and storage class memory solutions, the ability to fully exploit the media becomes more important. This is because both NVMe SSDs and Intel Optane drives are capable of massive parallelism at very low latencies. If your storage array can’t optimise the use of the media, then that bathtub curve is going to dip significantly, and some performance is going to be left on the table.
The Architect’s View
Hero numbers are a great starting point for comparing vendor products against each other. But as with anything, the devil is in the detail. Potential customers of all-flash vendors need to be asking what performance looks like across the whole spectrum of read/write ratios, rather than just at the extremes.
Don’t forget, of course, that mixed workload environments generate a whole range of differing I/O profiles, with combinations of sequential/random, big/large block sizes and burst/stream type traffic too. If you’re going to commit to a platform, get your (potential) vendor to show you a range of real-world performance numbers, preferably associated to practical applications, such as databases, virtualisation or analytics.
If we learned anything from the first two phases of all-flash development, it’s that not all platforms operate the same way. Unsurprisingly, getting real-world performance numbers and running Proofs of Concept (POCs) are still the best way of validating vendor performance claims.
Comments are always welcome; please read our Comments Policy. If you have any related links of interest, please feel free to add them as a comment for consideration.
Copyright (c) 2007-2019 – Post #905C – Brookend Ltd, first published on https://www.architecting.it/blog, do not reproduce without permission.