

Seagate Technology Holdings PLC has announced financial results for the first quarter of FY2025, ending 27 September 2024. The data shows revenue of $2.17 billion for the quarter, an increase of 49.1% year-on-year and 14.9% sequentially. The business continues to grow stronger, but what can the underlying shipping statistics tell us about what’s really going on in the storage industry?
Background
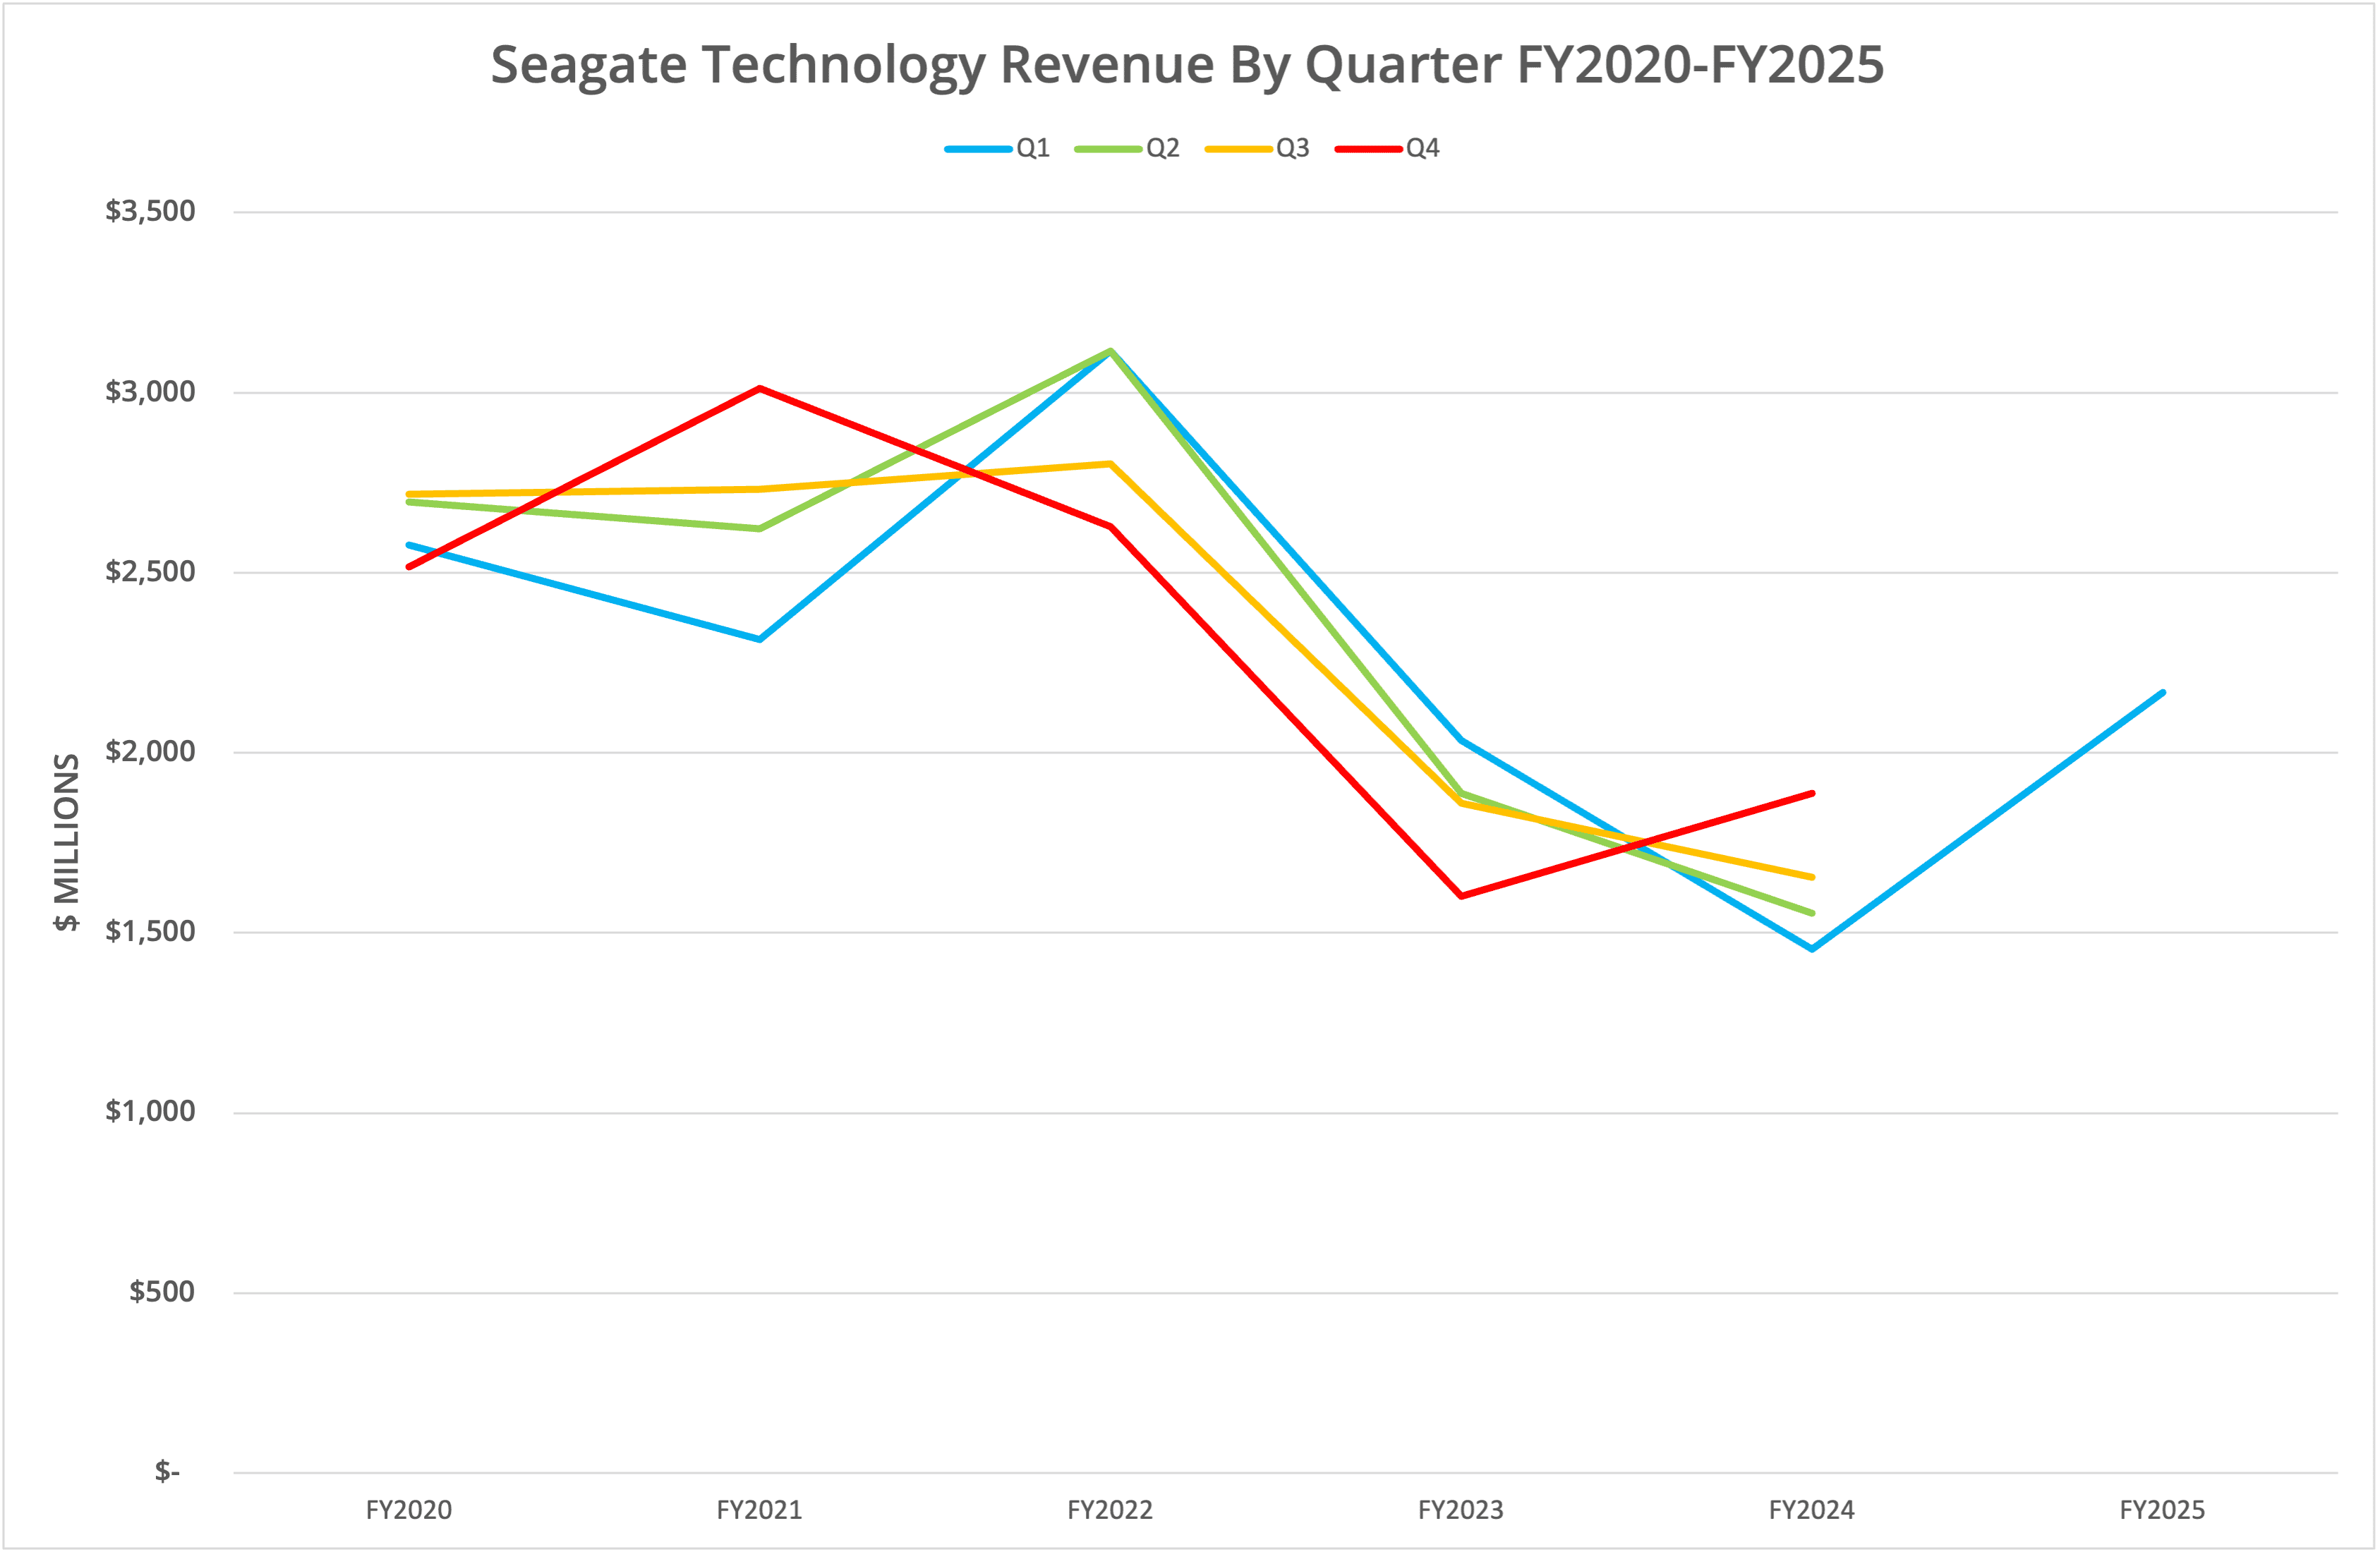
Seagate Technology Holdings PLC has published financial data for the period Q1 FY2025, which ends on 27 September 2024. Revenue for the period was $2.17 billion, up 49.1% compared to Q1 FY2024 and 14.9% sequentially (compared to Q4 FY2024). We present the data in 7 graphs, labelled Figures 1 to 7.
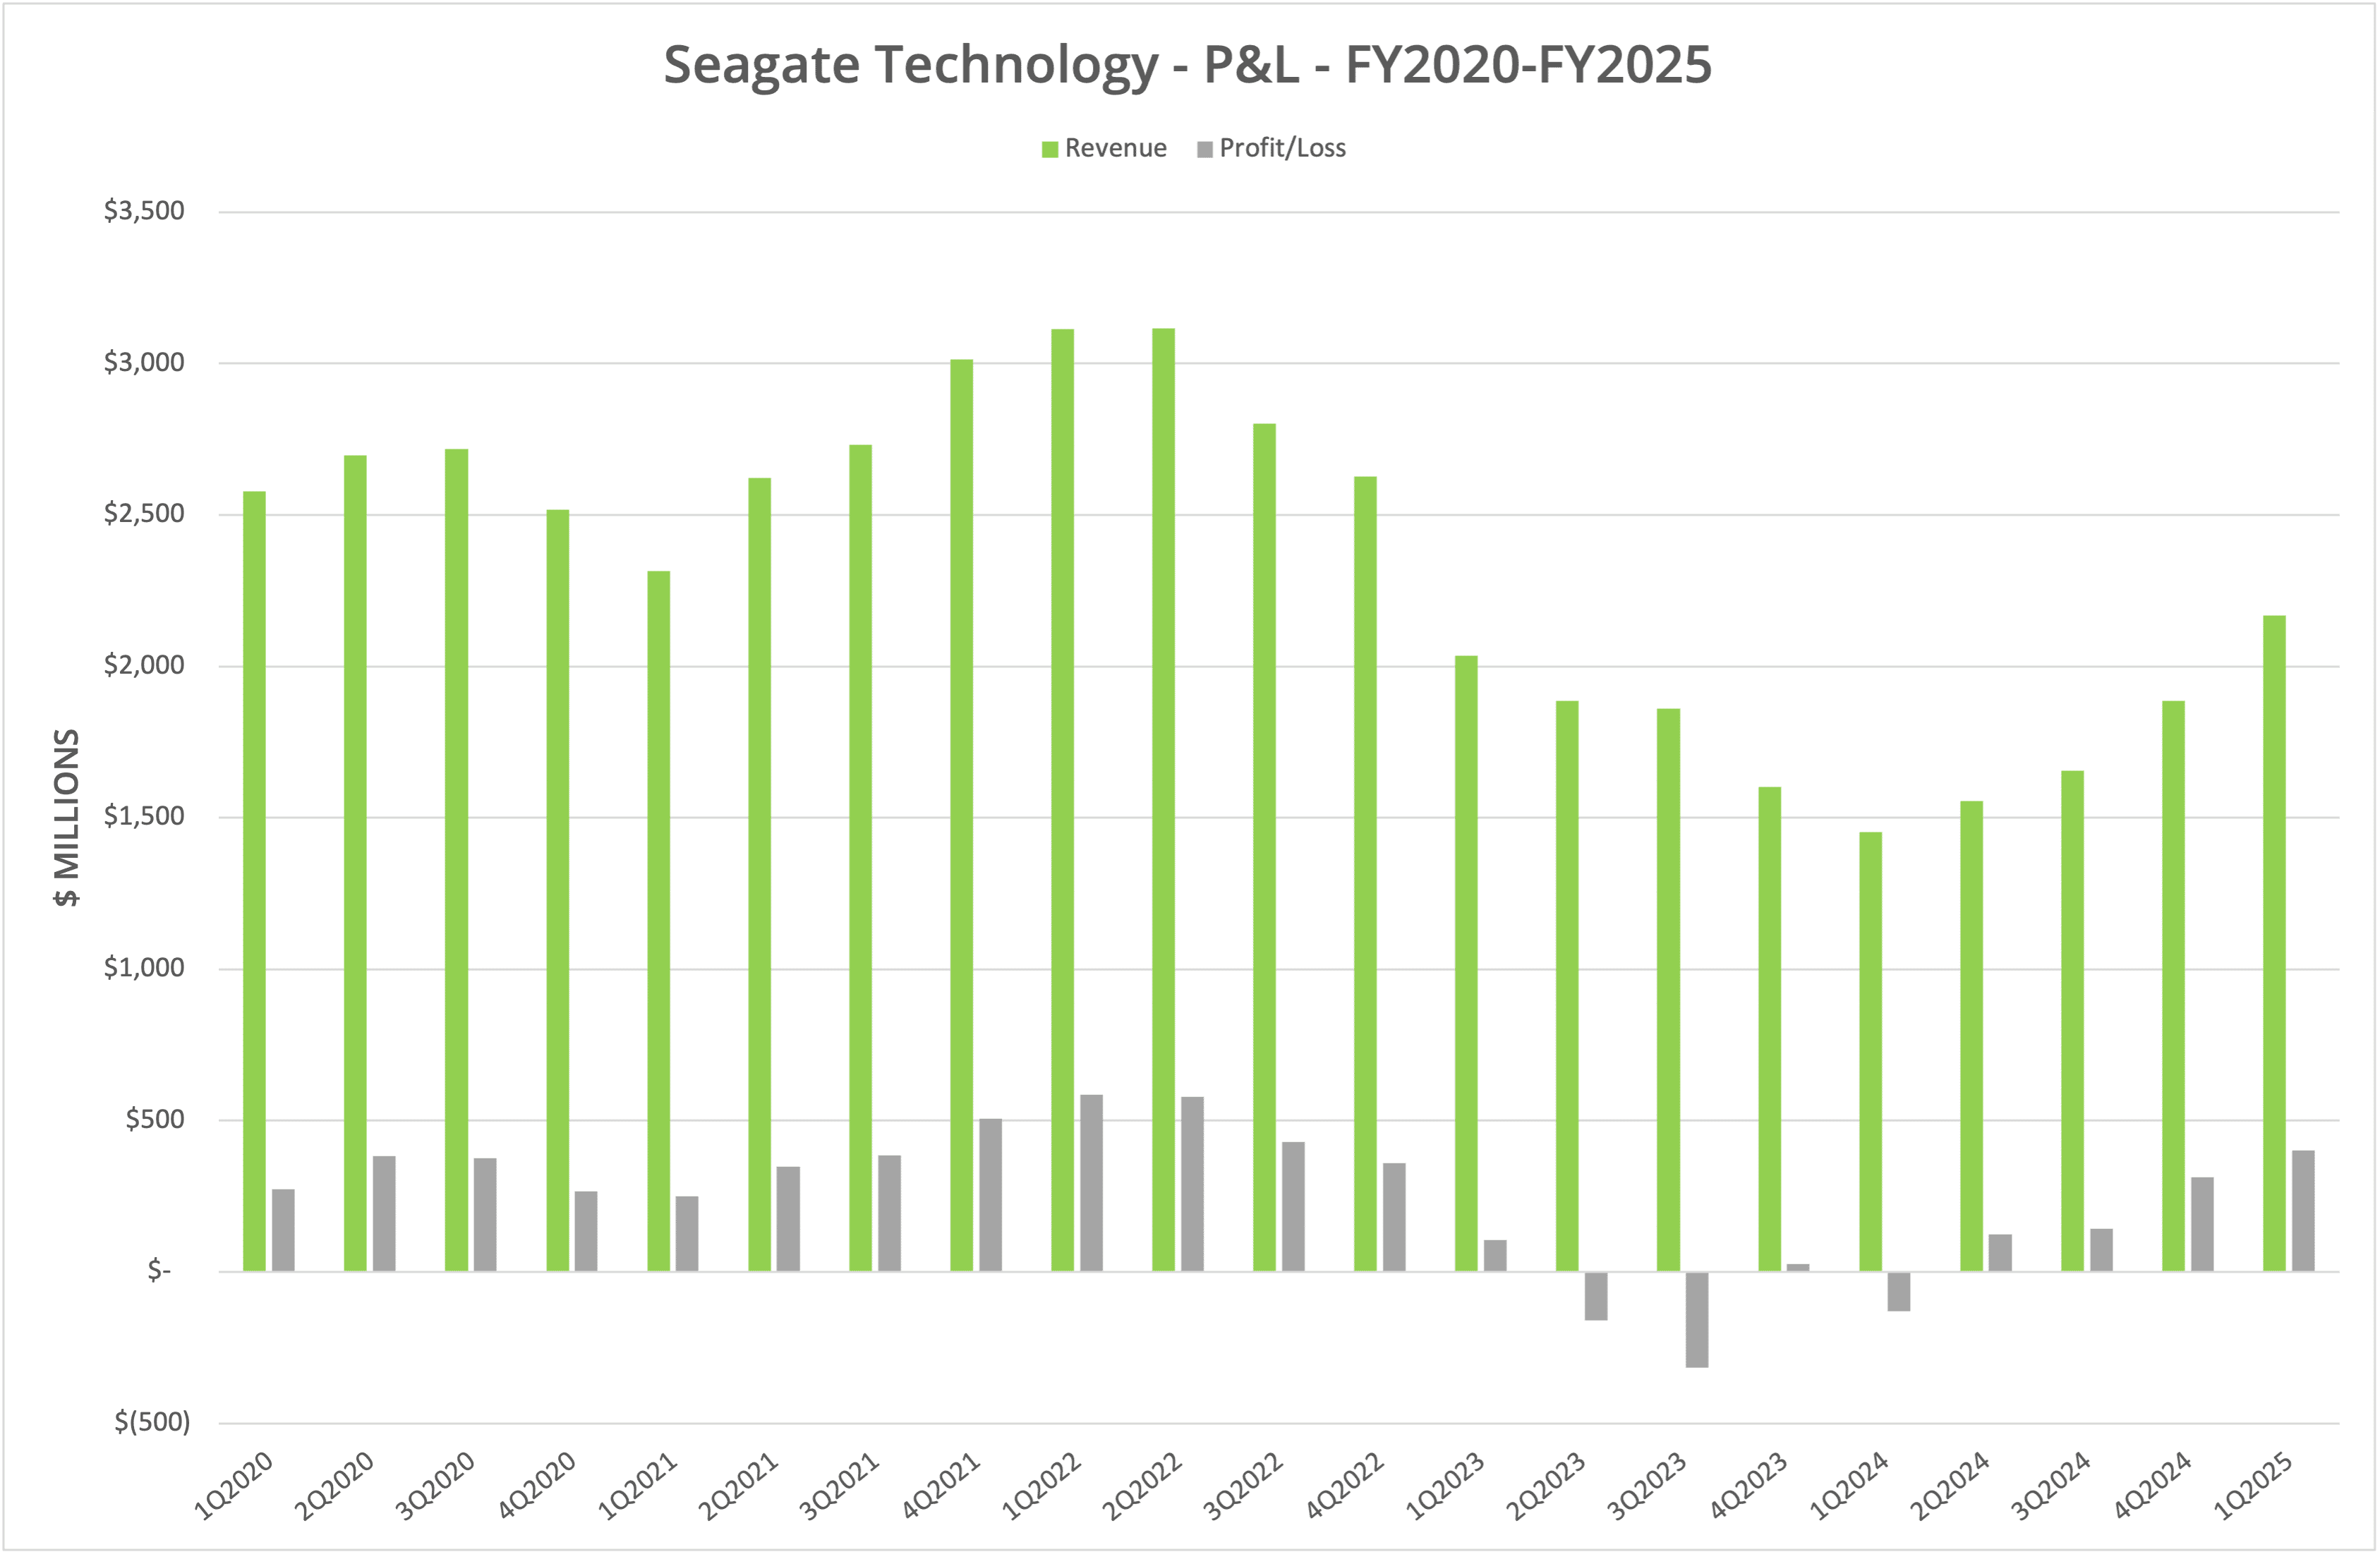
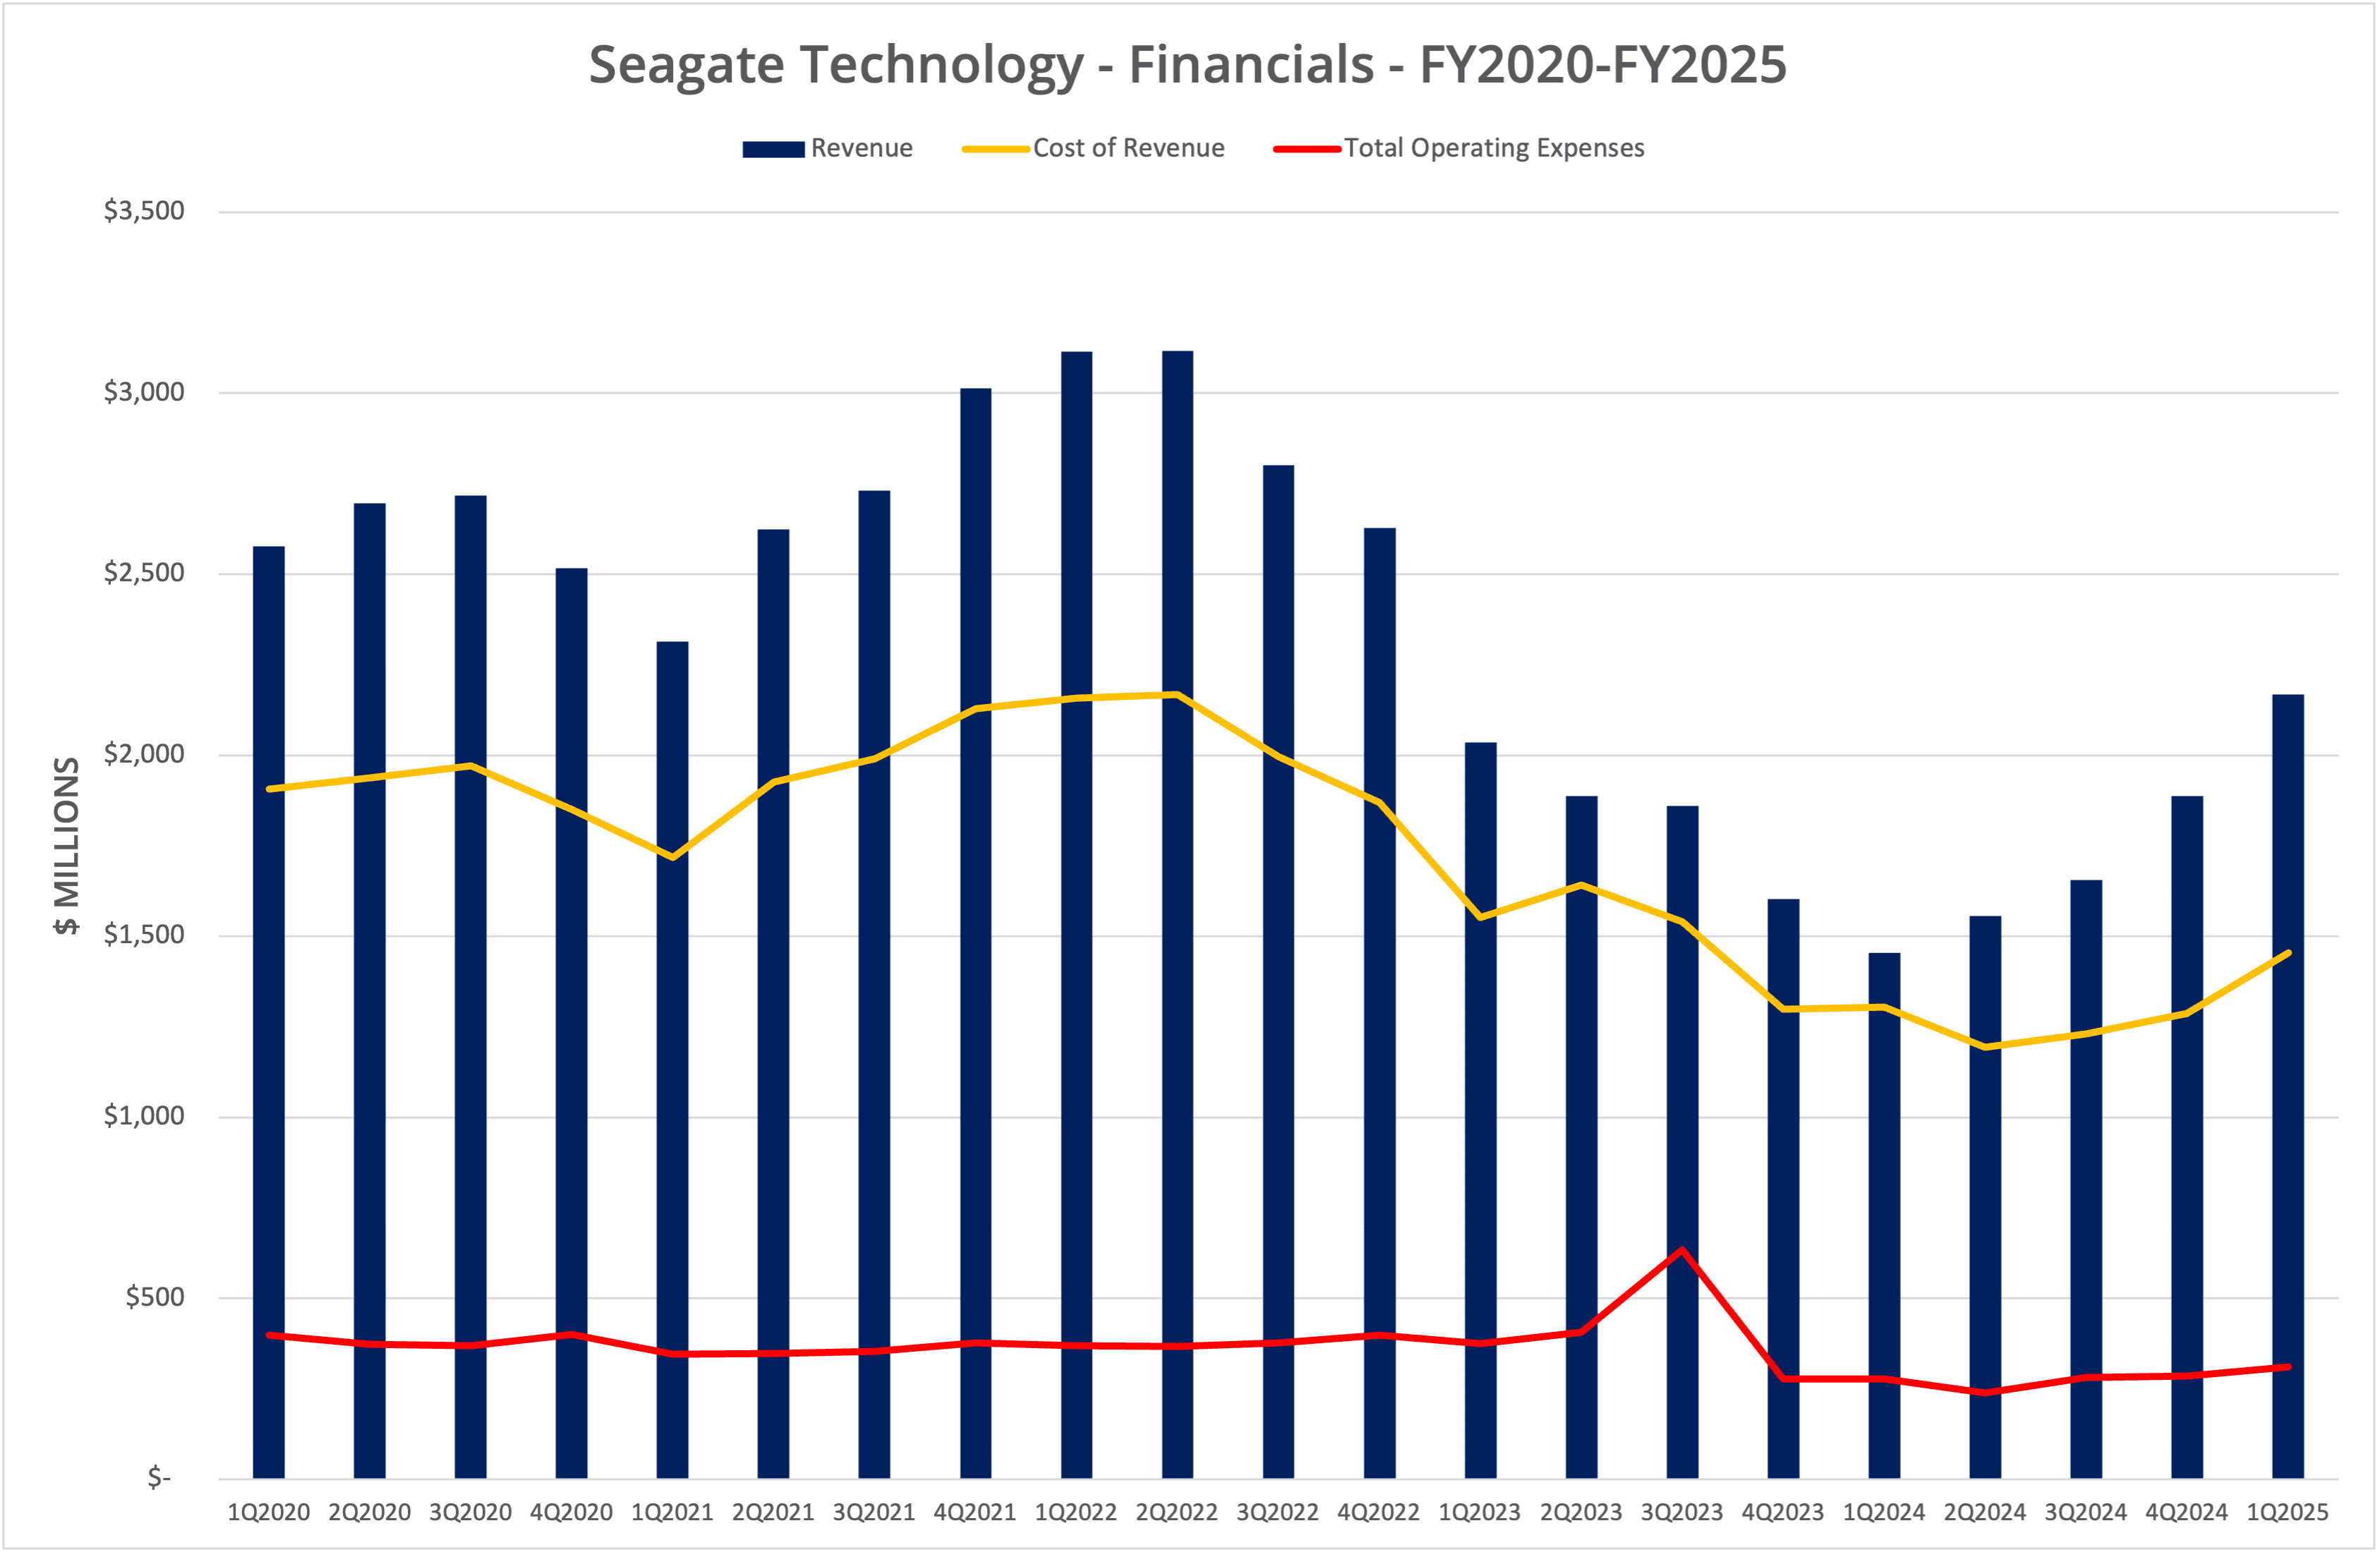
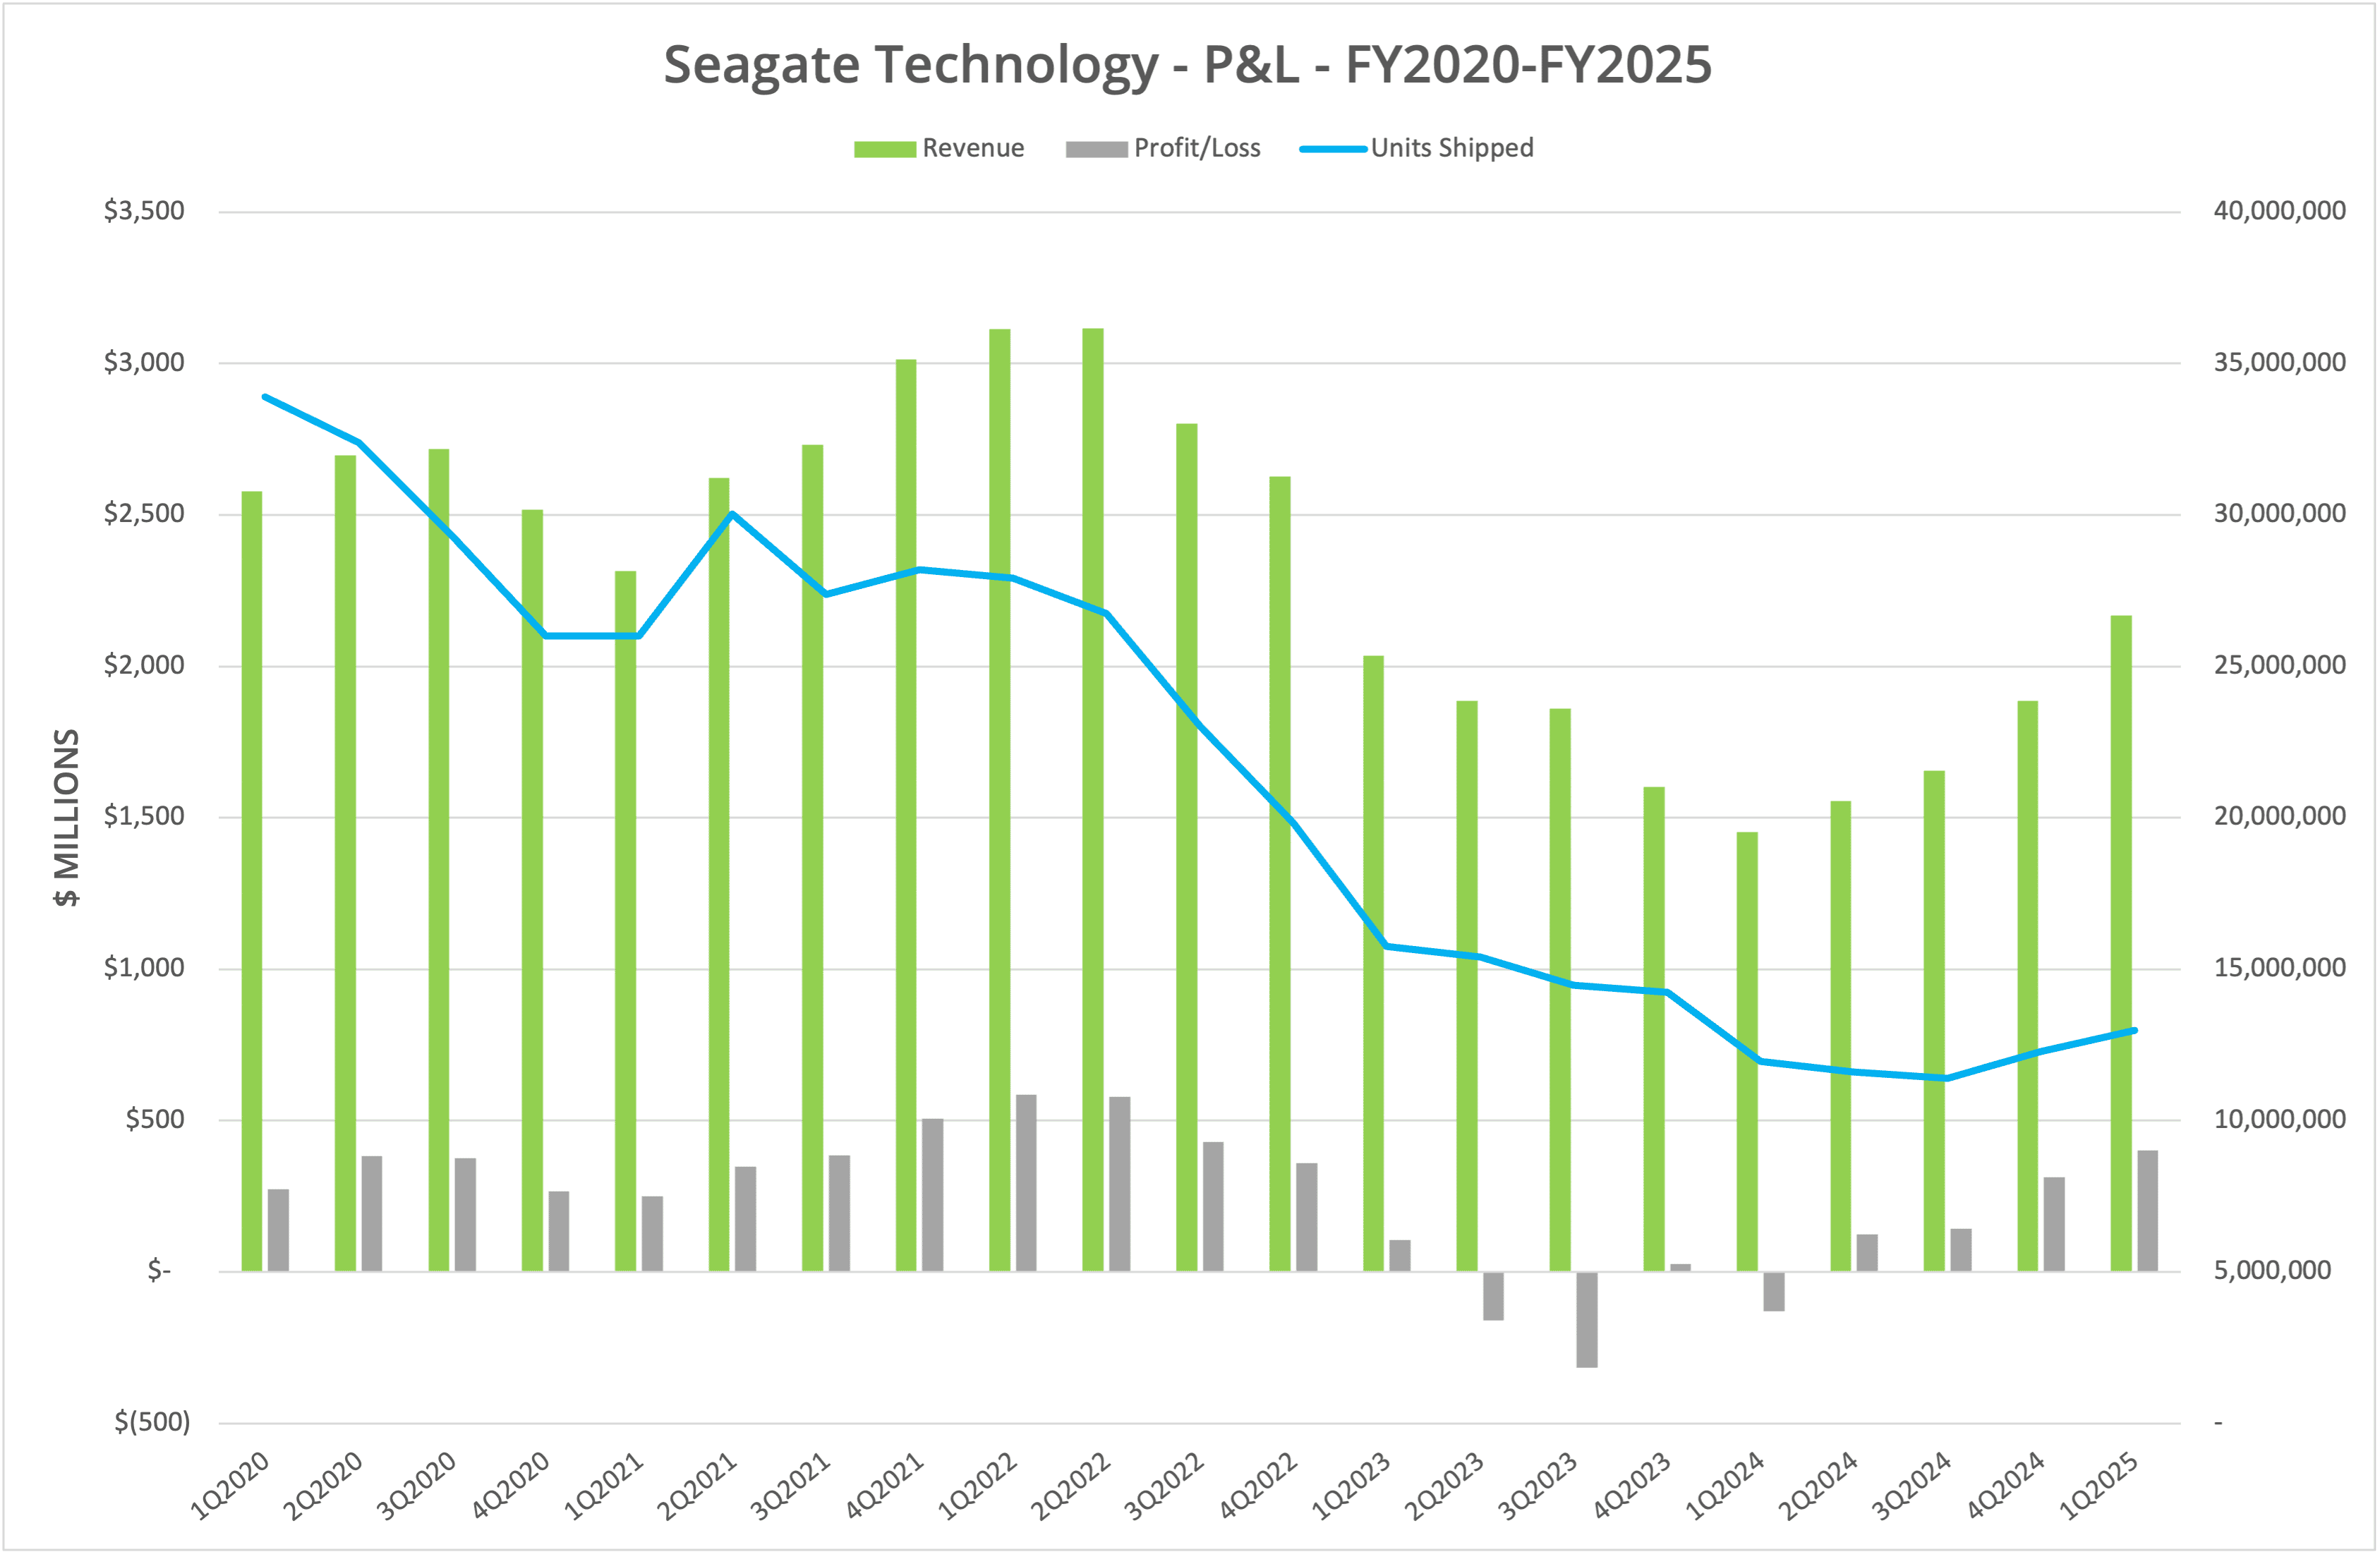
Figure 1 shows the quarterly profit and loss, which indicates that over the last four quarters, Seagate has returned to profit and increased revenue in each quarter. However, the results are nowhere near the recent peak of FY2022 and in particular quarters Q1 and Q2 of that year.
Units
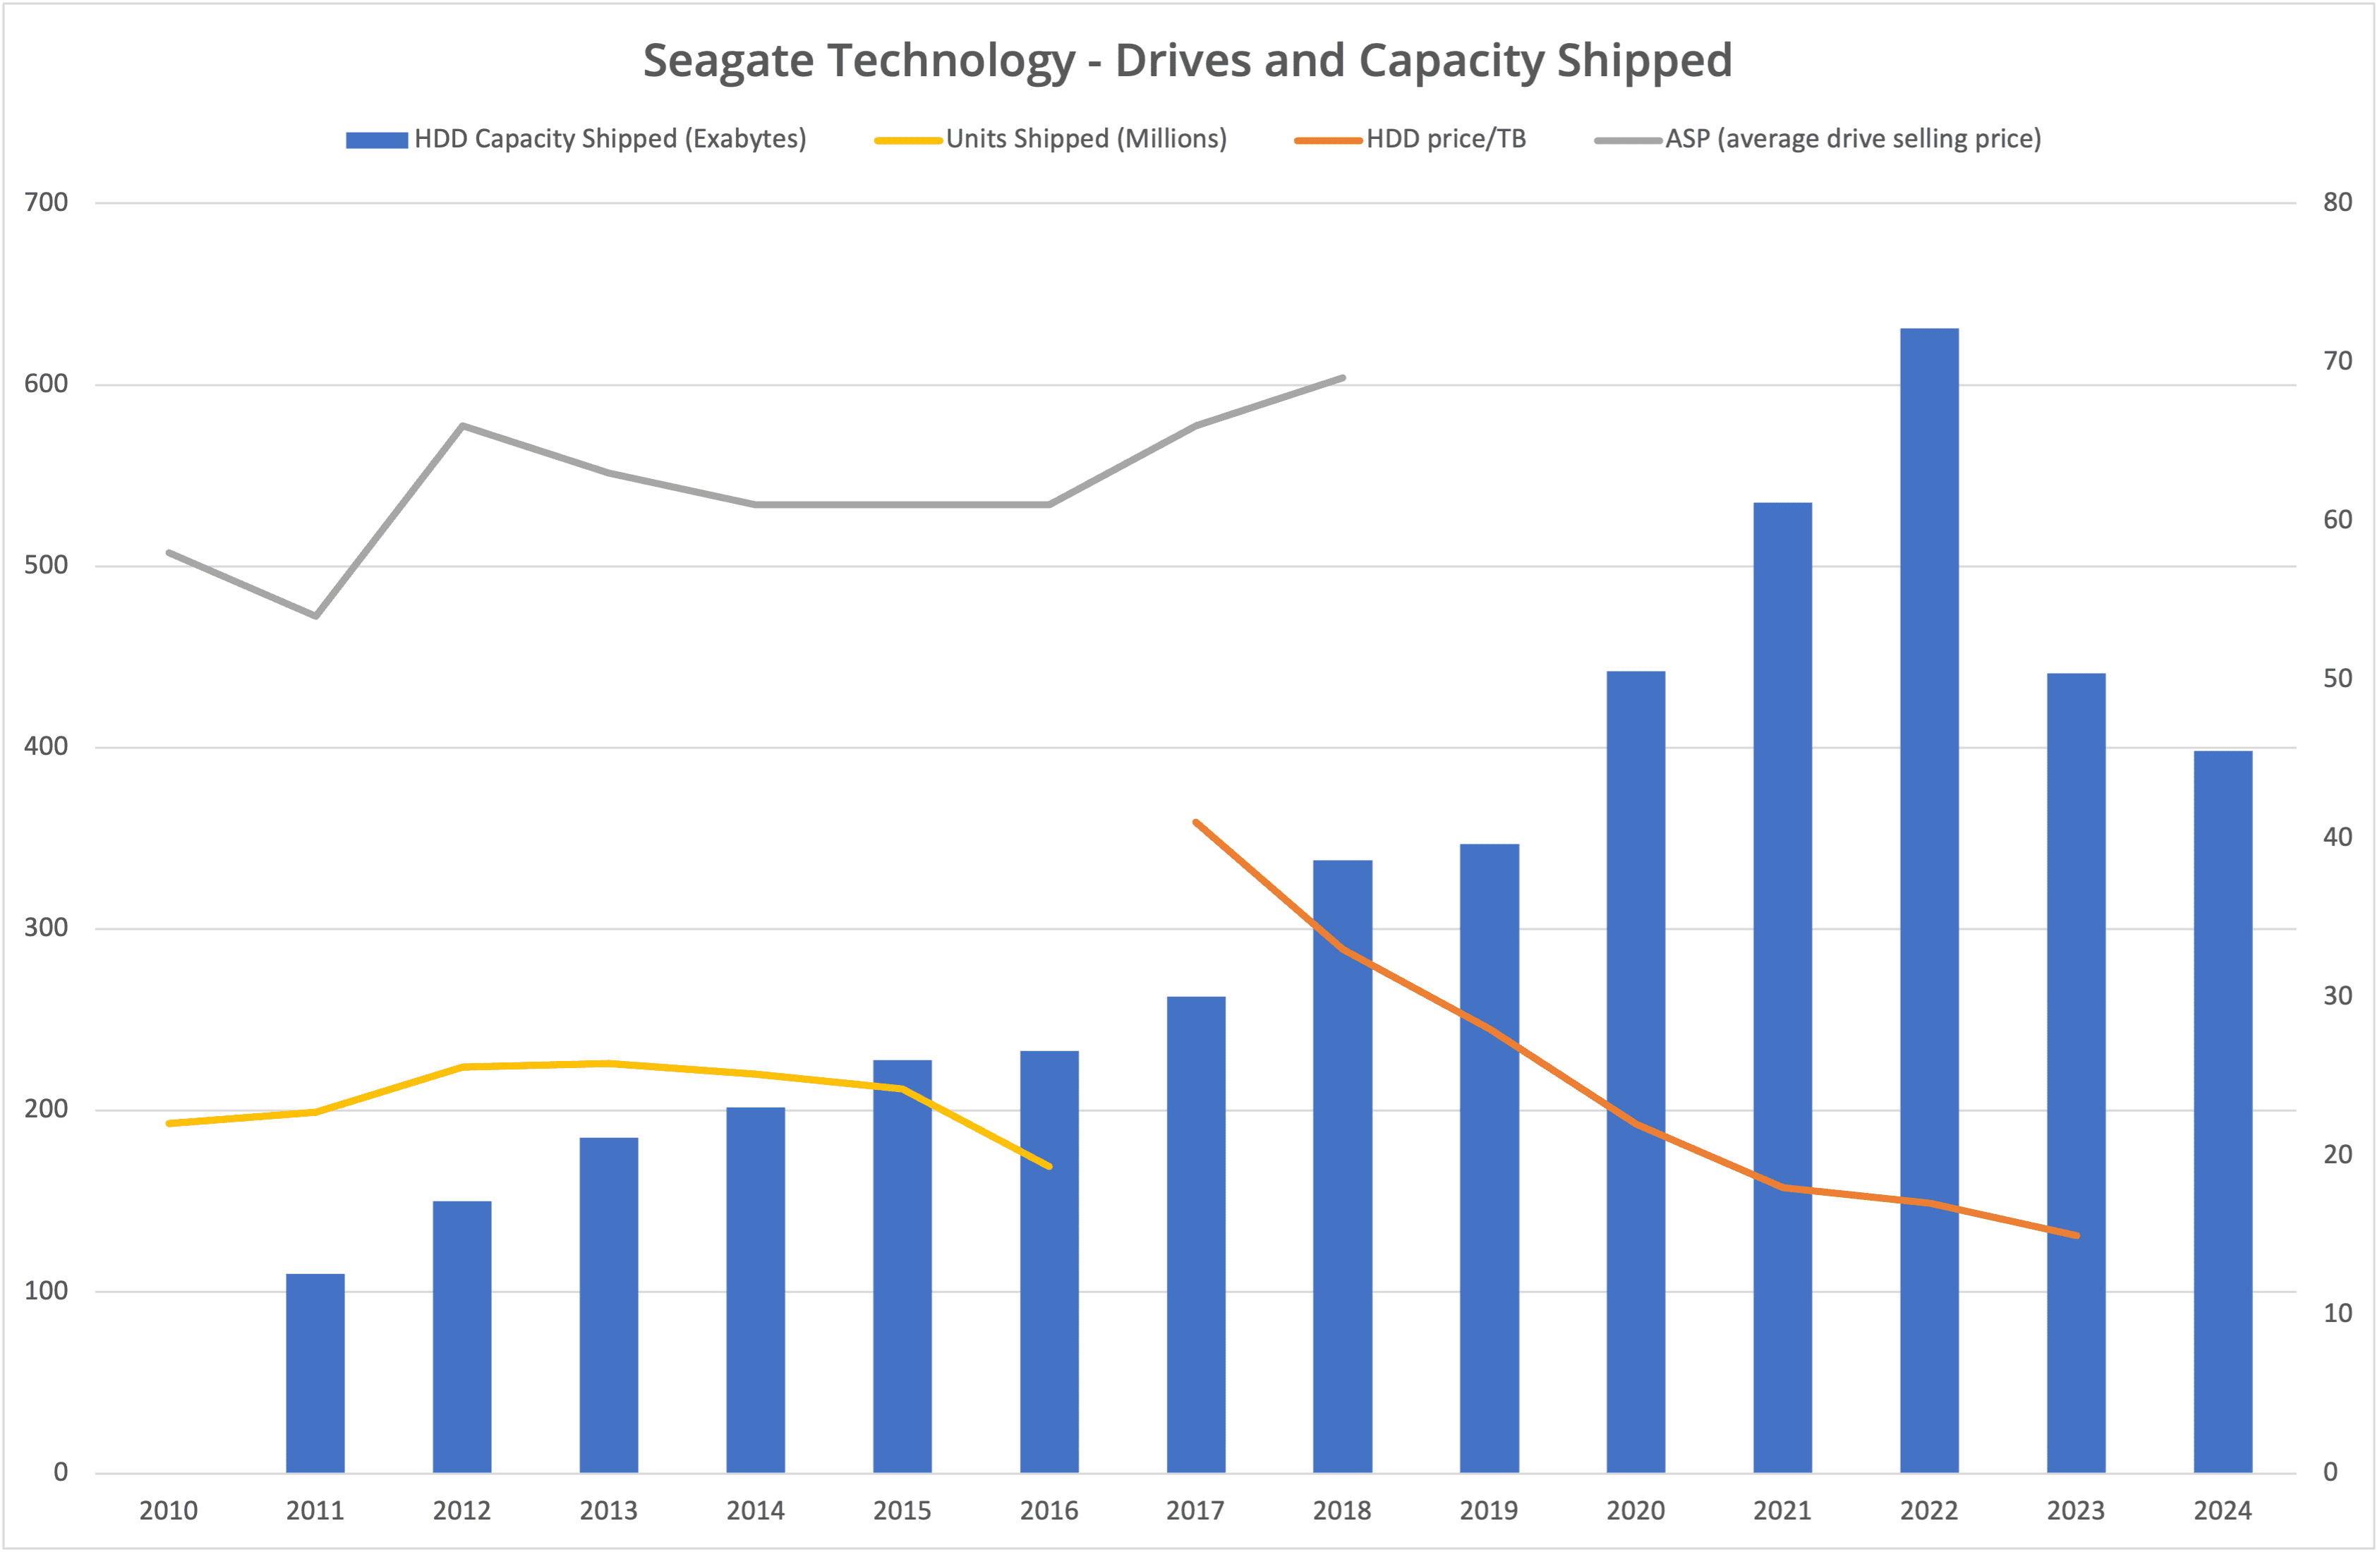
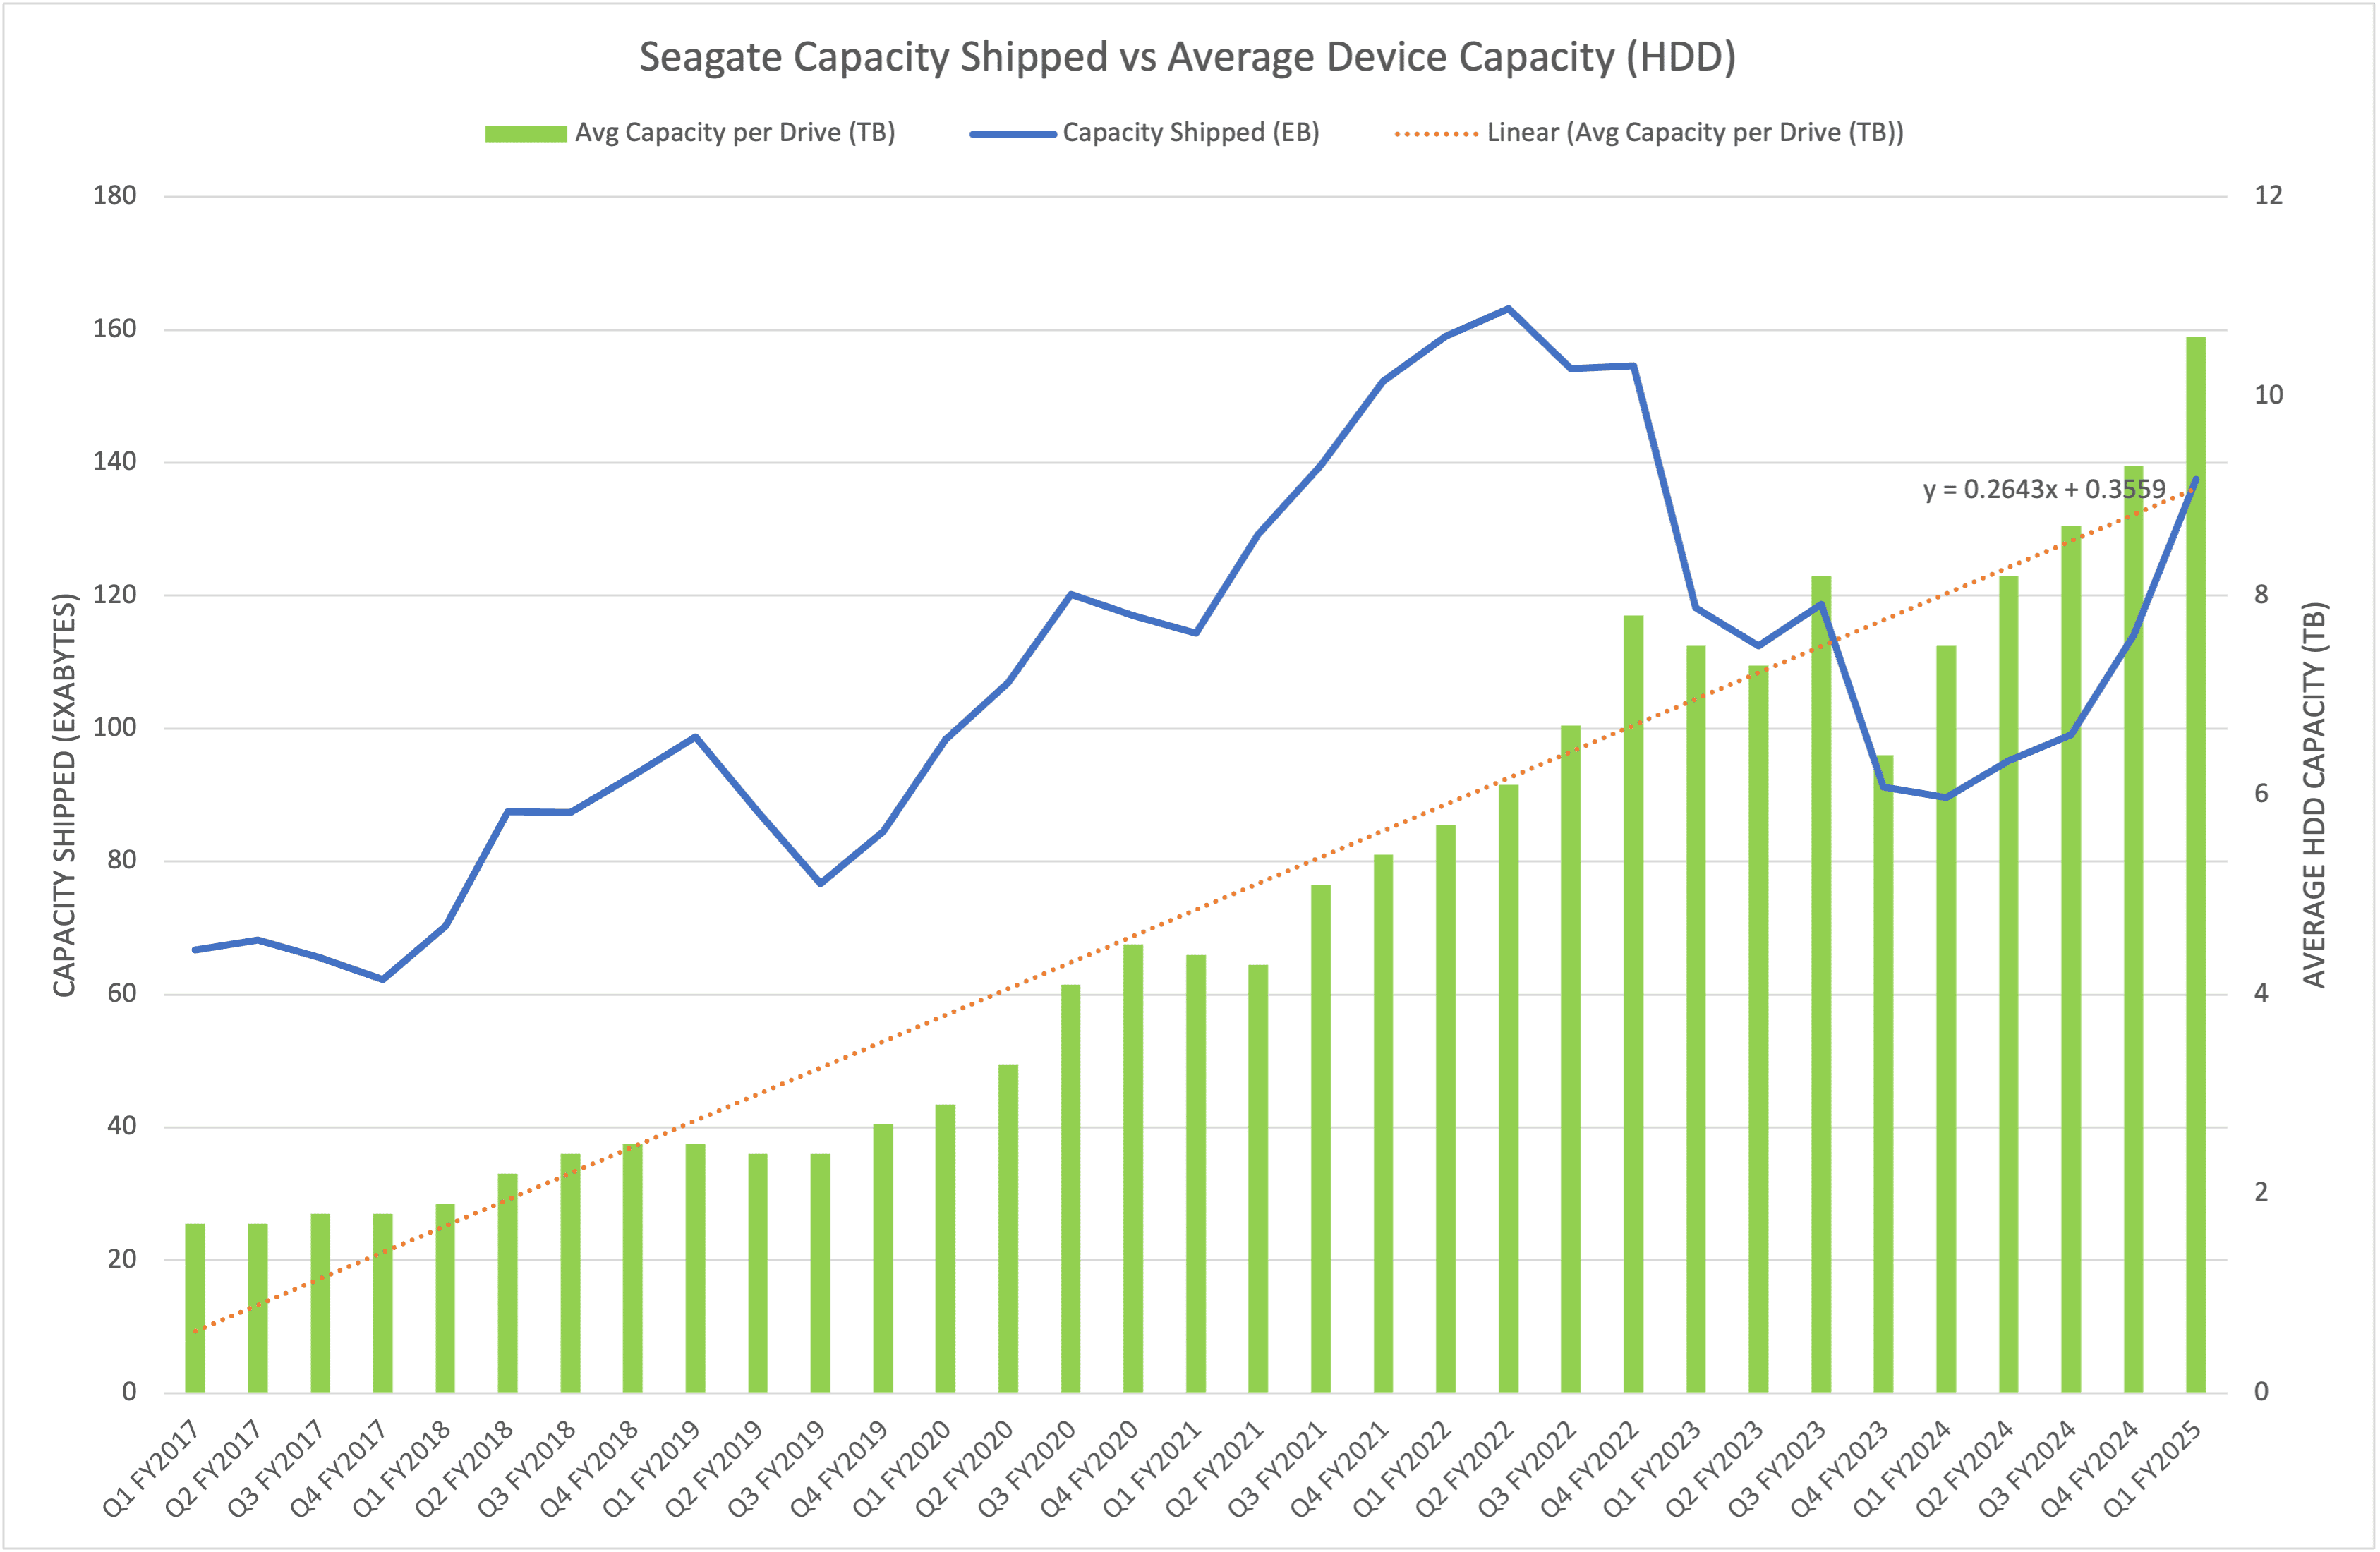
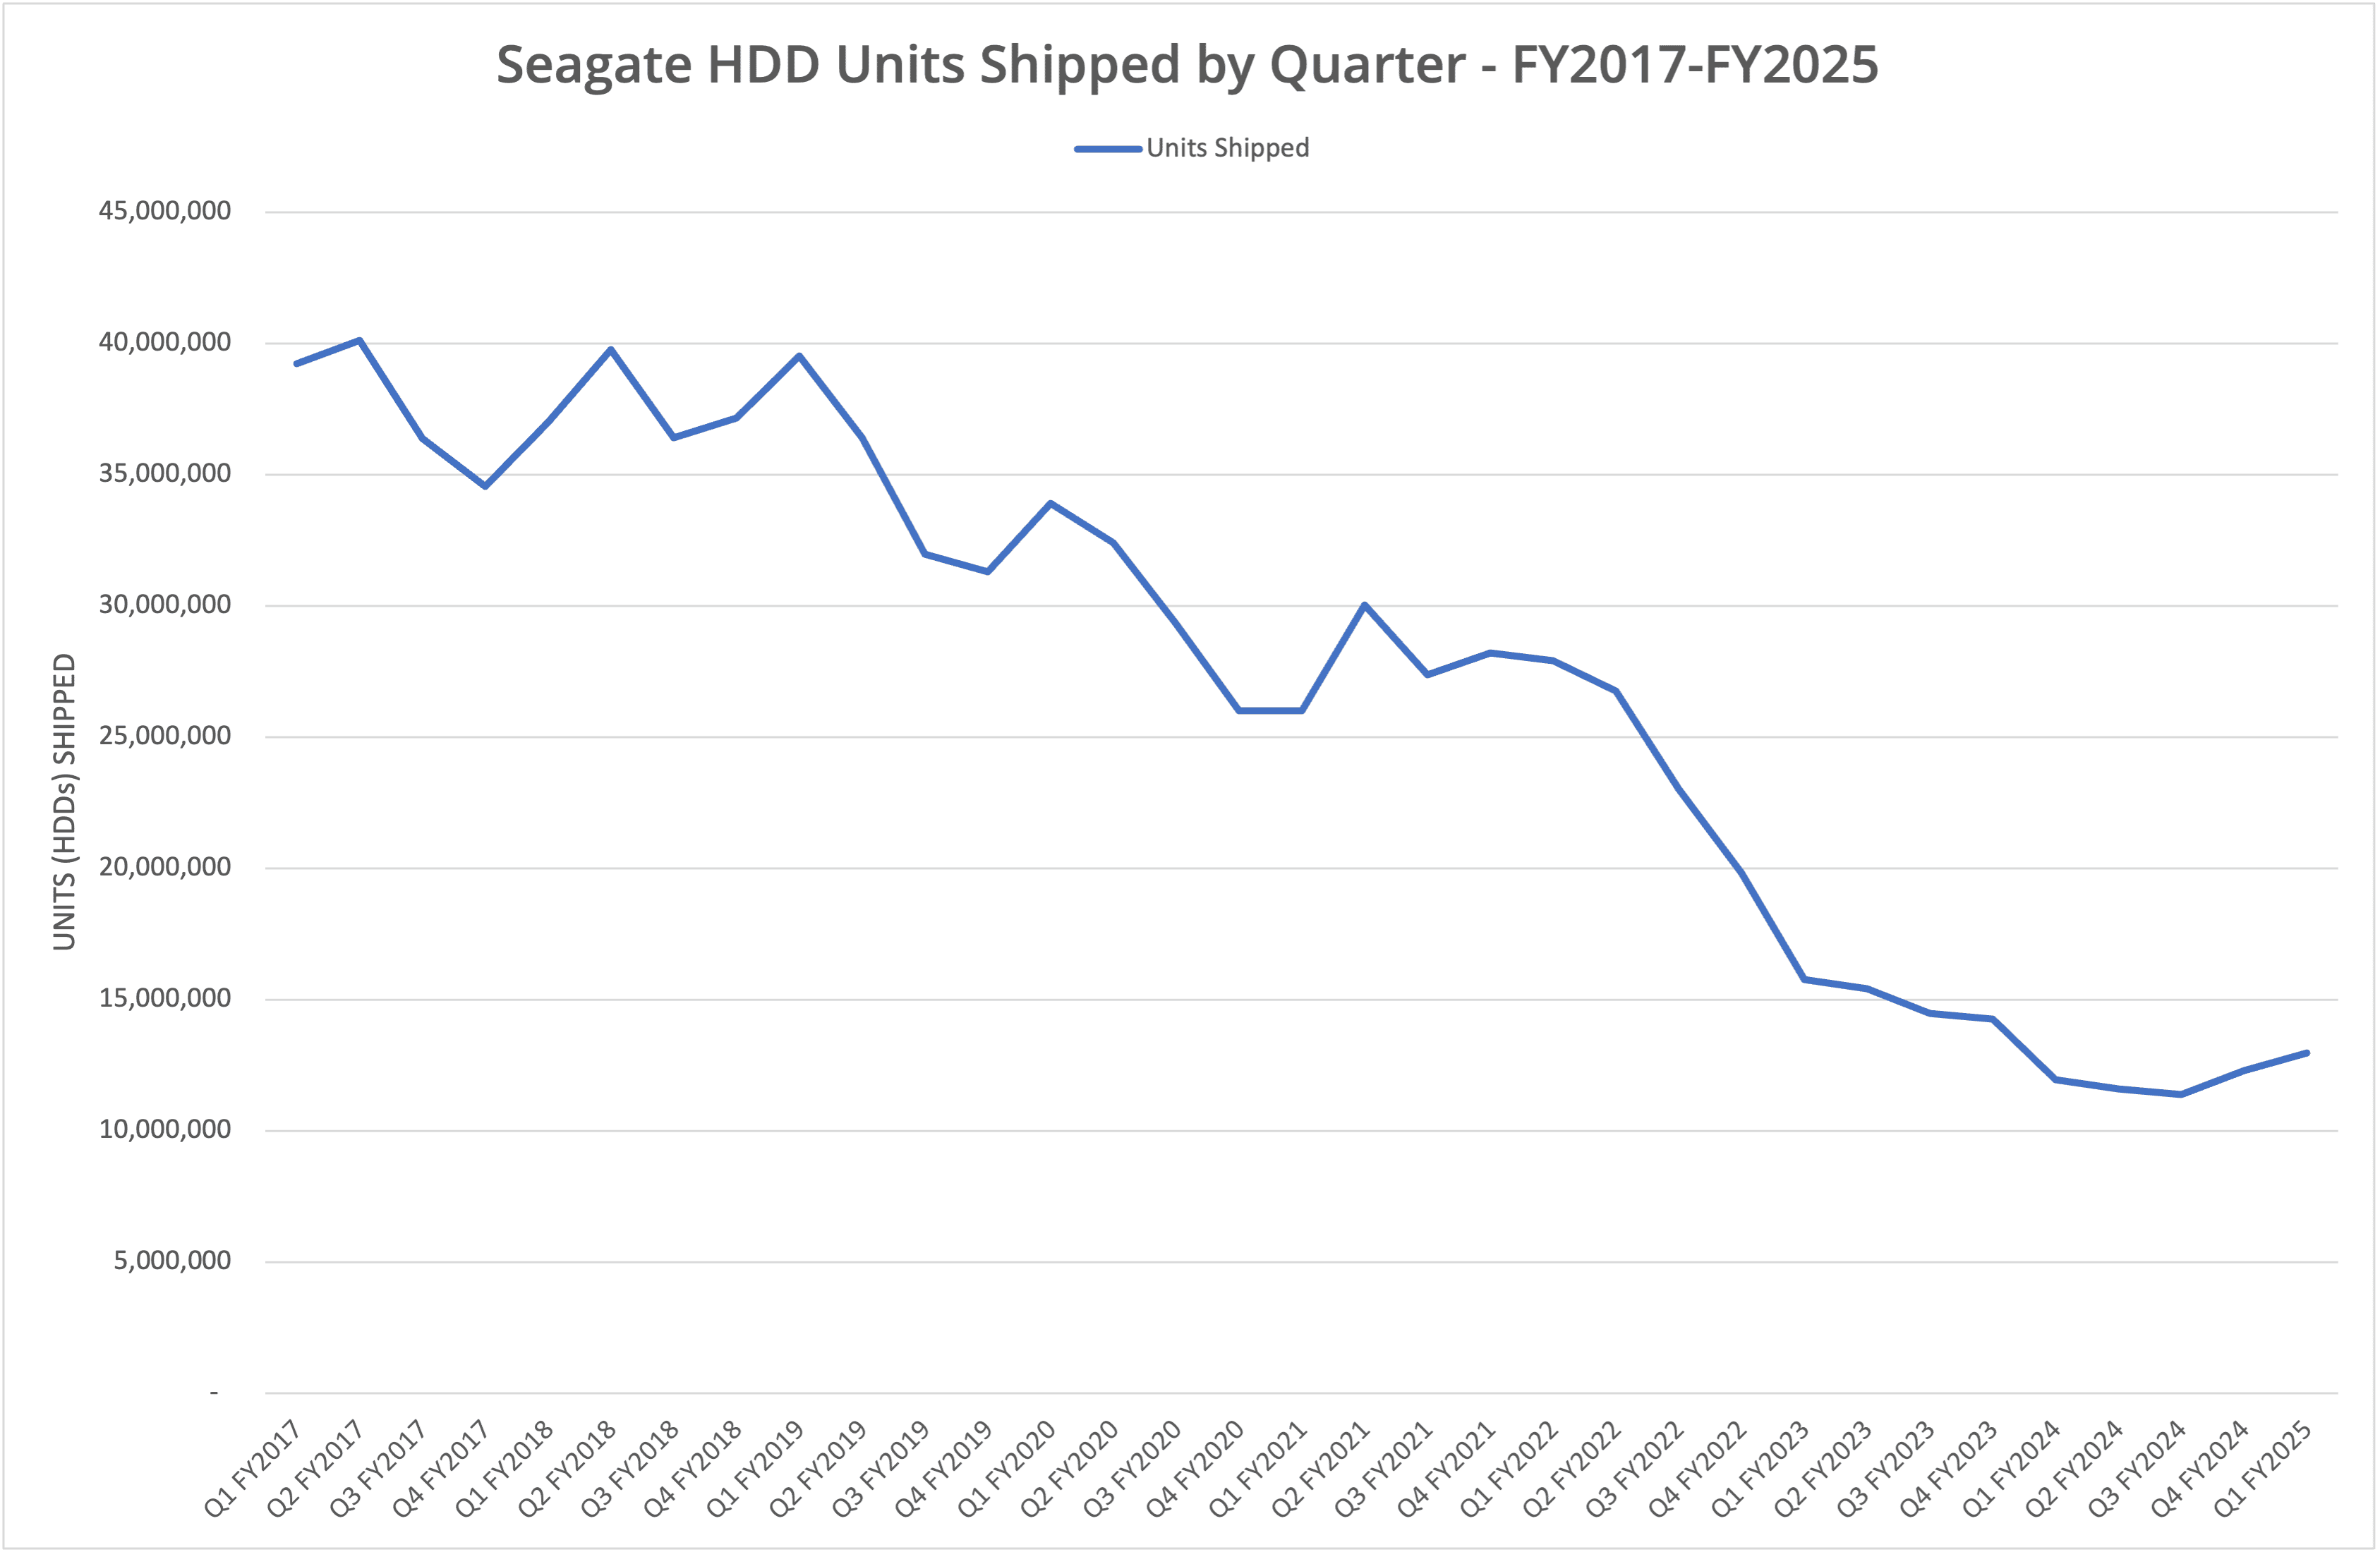
What’s probably more interesting is the breakdown of capacity and units shipped compared with the average device capacity. Seagate previously showed various versions of the shipping data, which we present in Figure 4. However, that information is incomplete as there have been varying versions of reporting in the published accounts over the years. We can see, though, exabytes of HDD capacity shipped vs the average capacity per device, which gives us an approximate number of units shipped in each quarter. This data is represented in figures 5 & 6, which show a comparison of the capacity shipped versus the average and the units shipped, both per quarter.
The unit capacity (on average) has increased ten-fold in eight years, representing not just a dramatic rise in the density of hard drives but also the move towards capacity devices as solid-state disks take over the performance part of the market.
Additionally, we can see that Seagate shipped capacity peaked in Q2 FY2022, also one of the best quarters in terms of revenue.
If we look at Figure 7, this shows the units shipped data overlaid on the P&L graph. There’s a clear correlation between revenue and the number of HDD units shipped in each quarter, although we can argue that the last three quarters have seen greater revenue increase than drive shipment increases.
Commodity
What does this data tell us? Firstly, we should caveat the information presented and say that averaging can hide some of the details. Seagate continues to ship “legacy” drives and some SSDs. There are also sales from systems in the mix. However, non-HDD sales accounted for only 7.6% of sales in Q1 FY2025, leaving 92.4% from hard drives, of which 87% is generated by “mass capacity” devices.
Seagate is a commodity business that wholly depends on the HDD market. As we can see from the graphs, specifically Figure 7, units shipped is a predictor of revenue (and vice versa), with arguably slightly more revenue per unit being made in the most recent quarters.
However, unit shipments are far from their peak of FY2017 and FY2018 that saw between 35 million and 40 million HDDs sold per period. Current numbers are a quarter of that and have declined steadily over the last eight years.
The Architect’s View®
The hard drive market is definitely not dead and has not been fully replaced by solid state disks. However, over the period shown in Figure 5, the annual average capacity increase of drives shipped has been around 28%, roughly in line (or slightly lower) than annual growth rate for data globally. Yet at the same time, Seagate has been shipping fewer drives, which implies that more data is landing on solid state disks than spinning media.
As we highlighted in the last review of Seagate financials, the company is seeing growth in demand from AI workloads, but still hasn’t seen widespread adoption of Mozaic (30TB+ drives). As those drives roll out, we can perhaps assume that unit shipments will be steady, meaning a flattening of Seagate’s revenue (average capacity goes up, units shipped stays flat or declines).
We continue to believe that further HDD market consolidation will take place. Western Digital is due to split its SSD business off into the SanDisk brand, leaving Seagate, WD and Toshiba as the three manufacturers and developers of HDD technology. The market may accept a merger of Seagate and WD (although regulators may not).
Would a hyper-scaler like AWS, Azure or Google be interested in buying Seagate? At just under $22 billion at the time of writing, the company is not that expensive, but picking a single HDD vendor would create some degree of risk if Mozaic fails to achieve its target goals. We believe it is more likely that a hyper-scale cloud vendor will acquire an SSD controller manufacturer and use that technology to build custom SSDs. This would ensure that NAND could continue to be sourced from multiple vendors – essentially the commodity component of an SSD.
HDDs have had a great run, but ultimately the market will shrink again. Whether the leading brand in the market retains the Seagate name is yet to be seen.
Copyright (c) 2007-2024 – Post #cdda – Brookend Ltd, first published on https://www.architecting.it/blog, do not reproduce without permission.